Back to Portfolio
Green Energy IoT — In Development
Open Source Planned • Play Store Roadmap
Sole Developer & Hardware Engineer

Helioview

A low-latency solar inverter Modbus telemetry platform — polling real-time energy metrics directly from inverter hardware over RS-232 serial, processed by a Raspberry Pi protocol gateway, and streamed live to a native Android app with interactive dashboards, weather forecasting, and solar yield prediction.

RS-232 / Modbus RTU Protocol
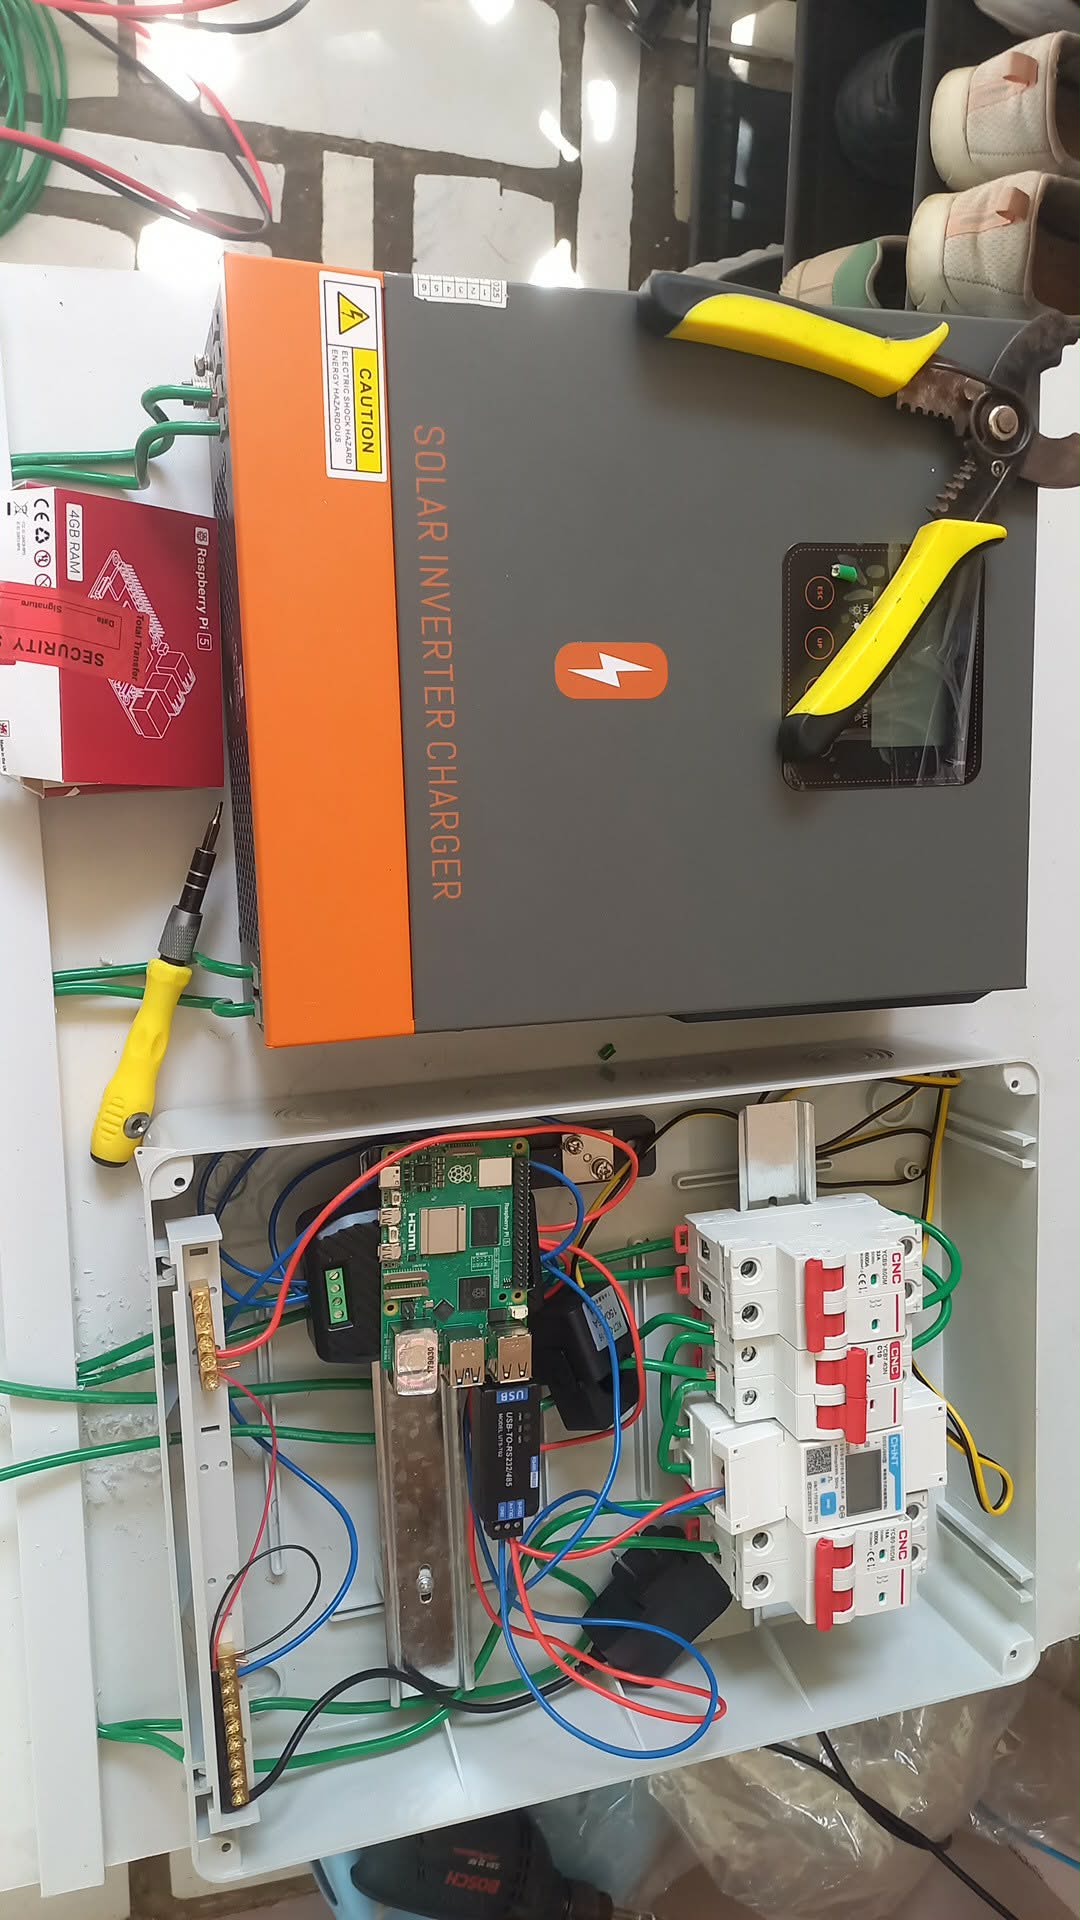
Raspberry Pi Gateway
Android App • WebSocket
Solar Yield Forecasting
View on LinkedIn

Four-Layer Edge-to-Mobile Stack

From raw inverter registers to interactive mobile dashboards — every layer is purpose-built for low latency and reliability in a residential or commercial solar environment.

Modbus
RS-232 serial polling directly from inverter hardware registers
Gateway
Raspberry Pi parsing protocol & serving REST API endpoints
Real-Time
WebSocket push from gateway to Android — no polling lag
Forecast
Weather-integrated solar yield prediction engine
L1
Solar Inverter Hardware
RS-232 / Modbus RTU register data source
L2
Raspberry Pi Protocol Gateway
Serial polling daemon, Modbus parsing, local REST API & WebSocket server
L3
REST API + WebSocket Endpoints
Secure streaming of parsed energy metrics to connected clients
L4
Android App (Helioview)
Real-time dashboards, historical charts, weather forecast & yield prediction

What Helioview Delivers

A complete solar monitoring solution that goes beyond basic readouts — combining live telemetry, predictive analytics, and historical performance tracking in a single mobile app.

Direct Inverter Hardware Interface
Communicates directly with commercial solar inverters over RS-232 serial using the Modbus RTU protocol — no cloud dependency, no manufacturer API. Raw register reads are parsed locally for zero-latency data access.
Real-Time WebSocket Telemetry
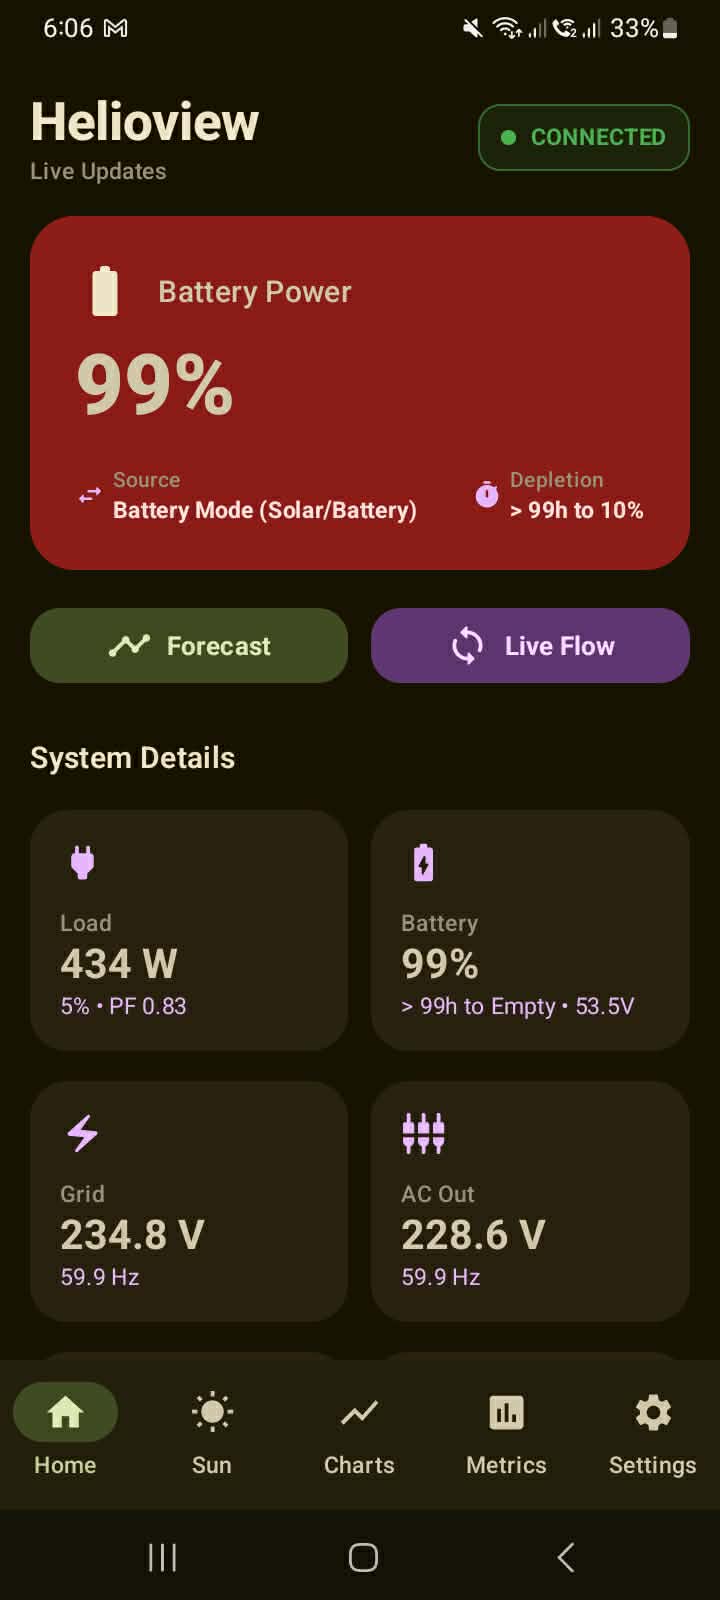
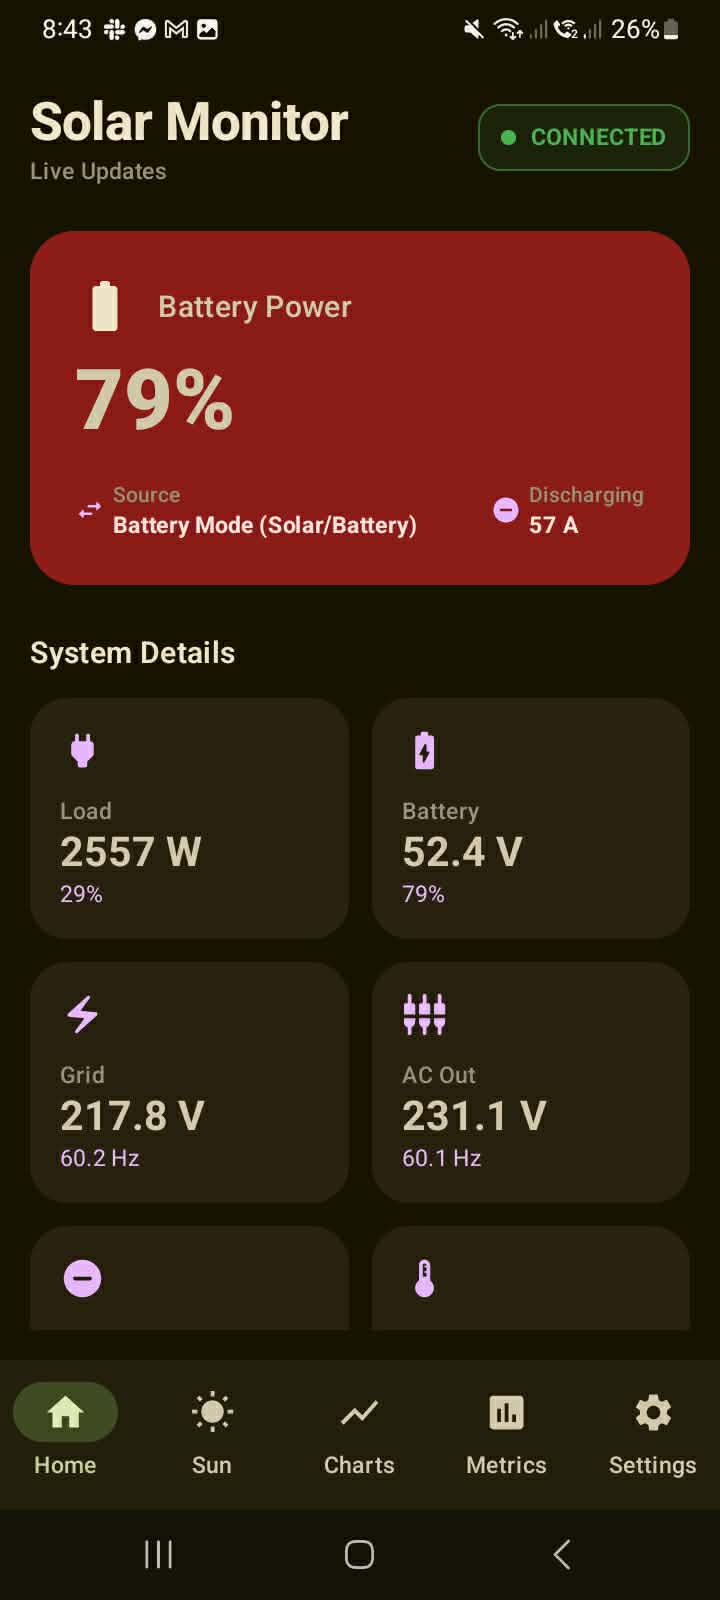
The Raspberry Pi gateway pushes parsed metrics to the Android app over WebSocket connections — delivering instantaneous efficiency readings, AC/DC load metrics, battery state, and grid export values as they change on the inverter.
Interactive Performance Dashboards
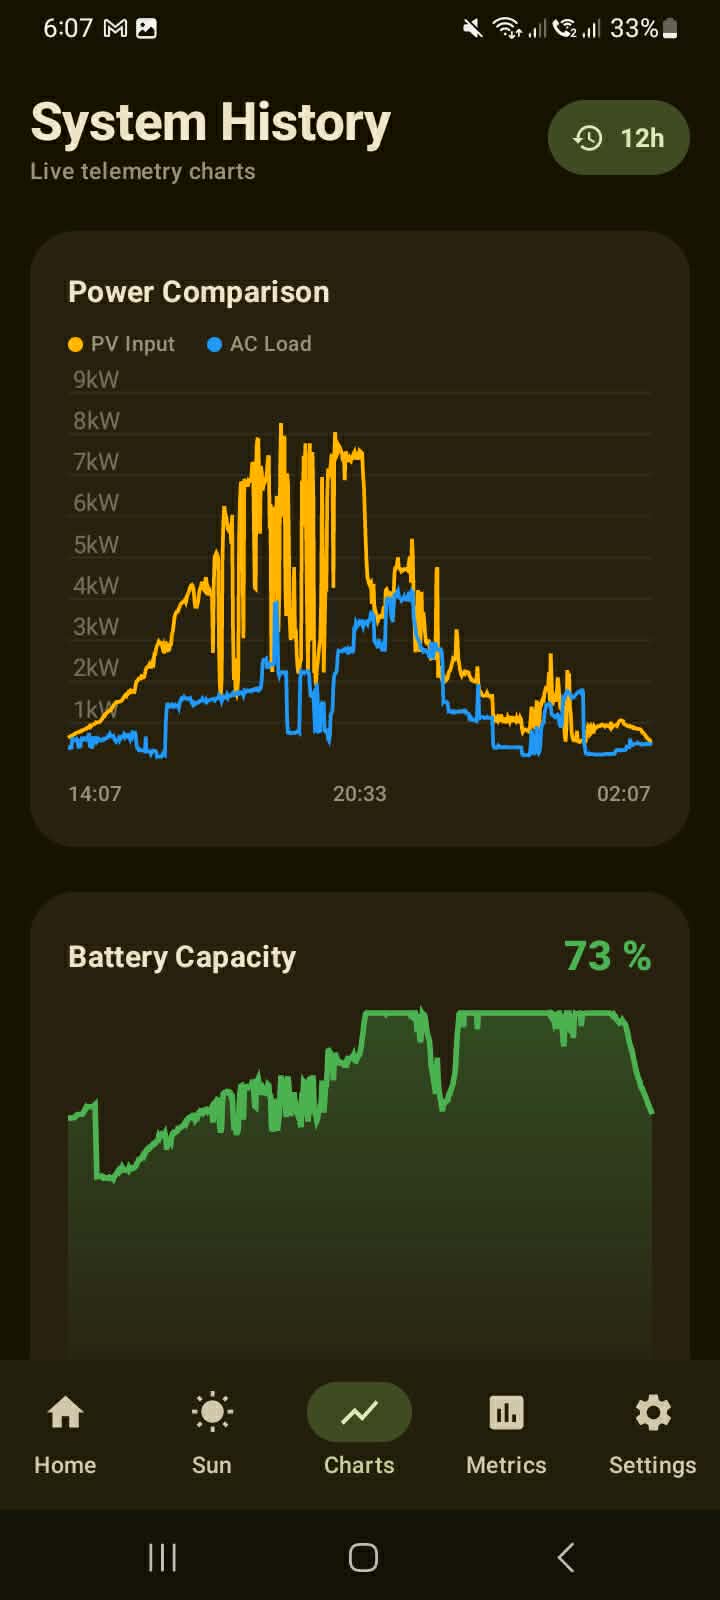
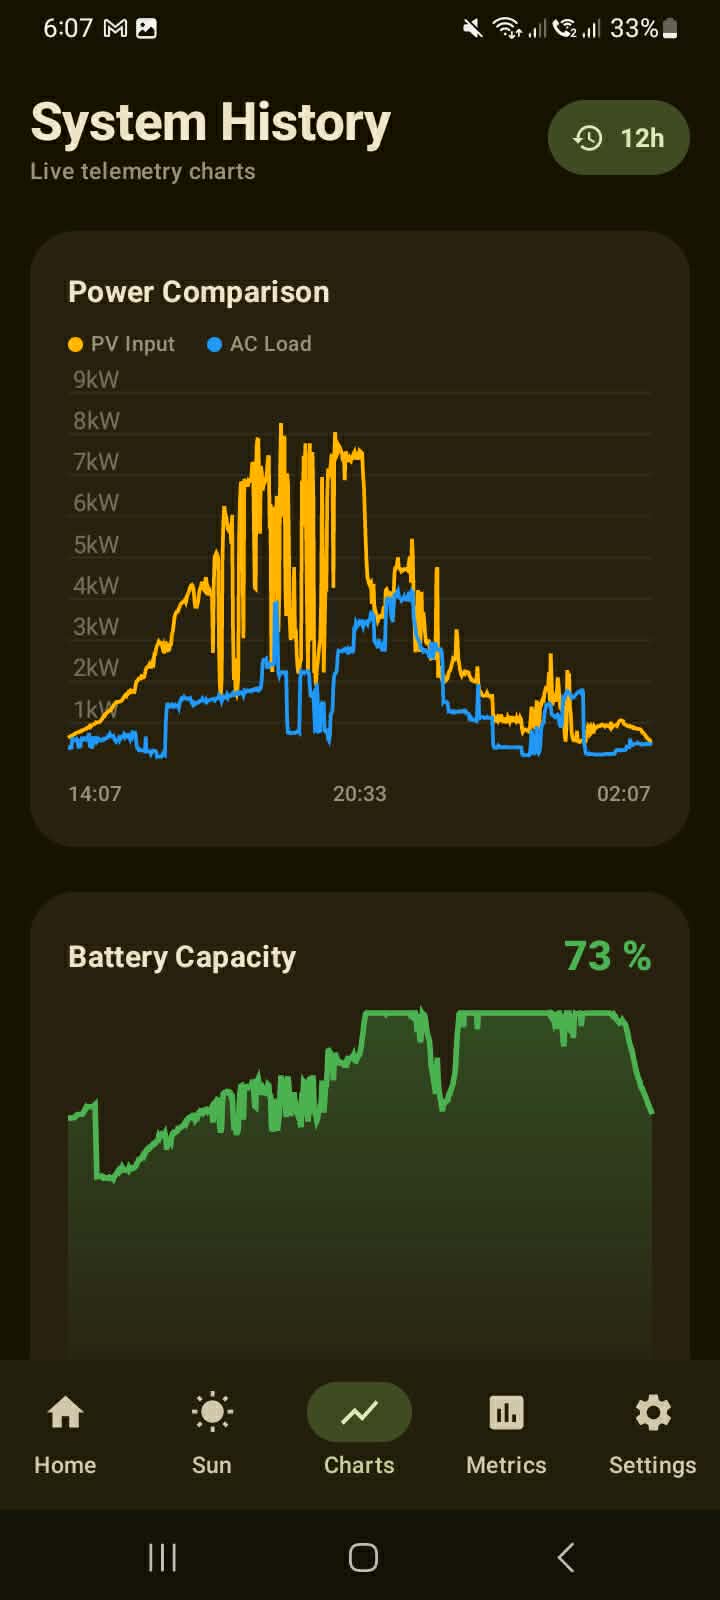
The Android app renders live and historical energy data as interactive charts — tracking power generation curves, load consumption, grid tie activity, and battery charge cycles over time with zoomable, scrollable visualizations.
Weather-Integrated Yield Forecast
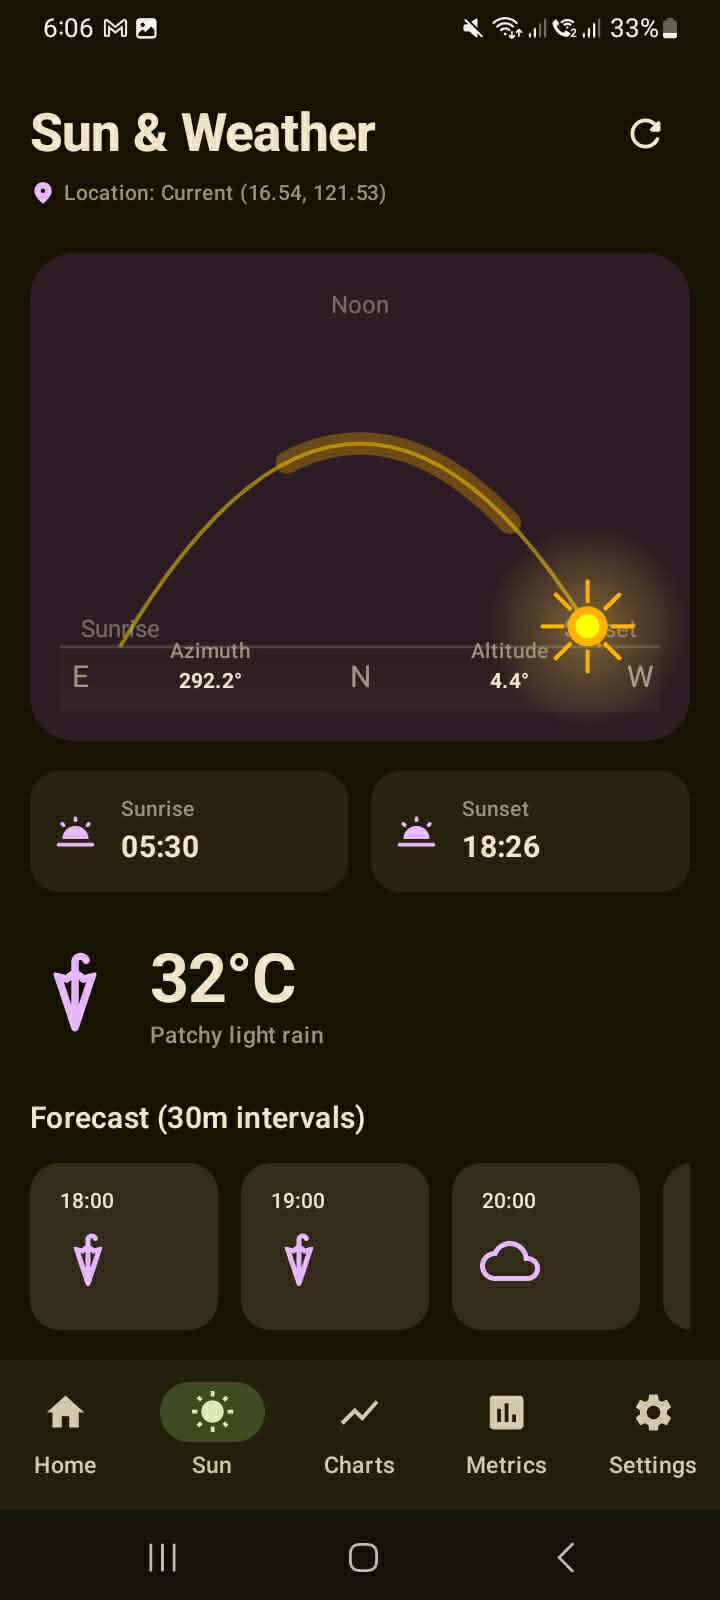
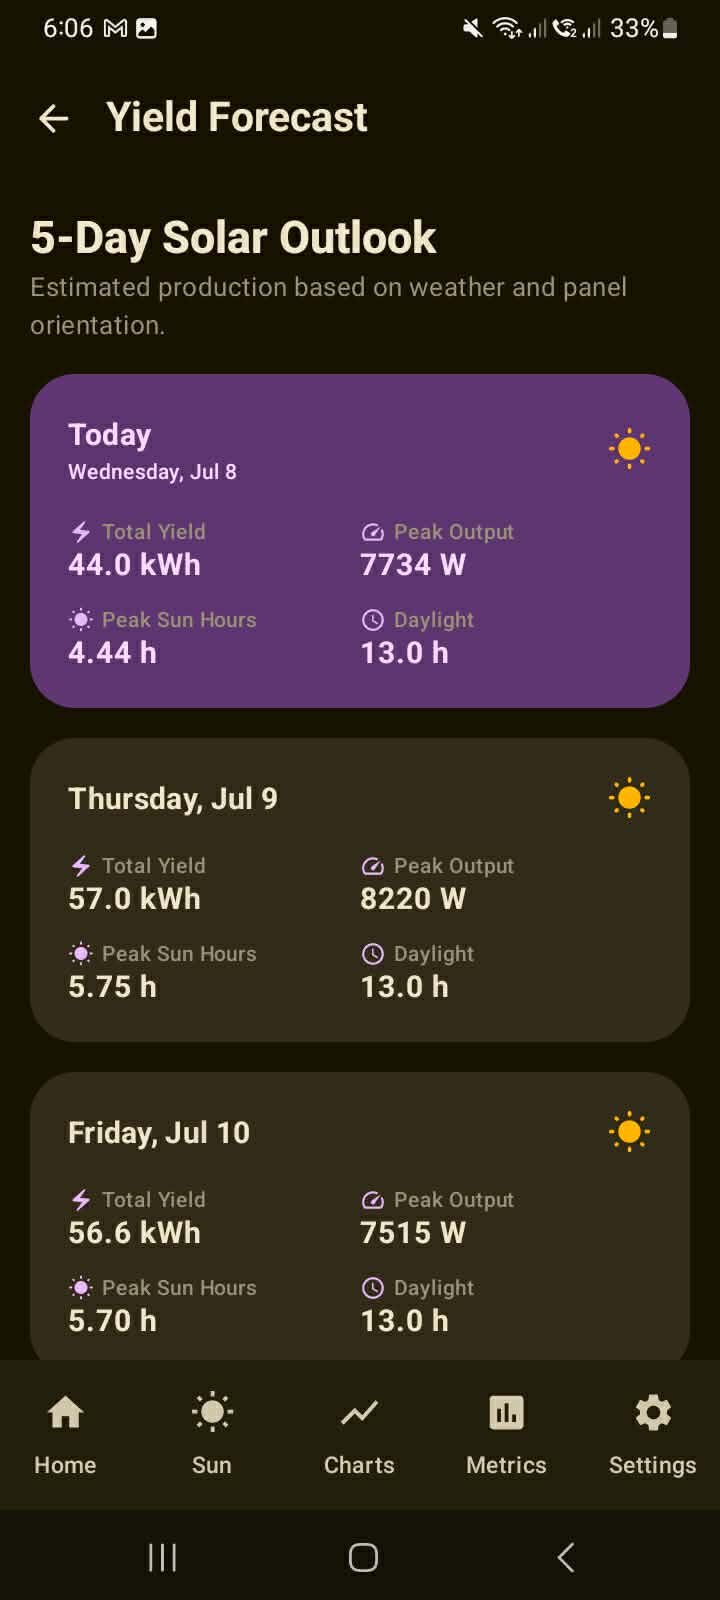
Integrates weather forecast data with the system's historical generation performance to predict expected solar yield for upcoming days — helping users plan high-consumption activities around peak generation windows.
Historical Performance Logging
All telemetry data is persisted locally on the gateway. The Android app can query and visualize historical generation and consumption records, enabling long-term efficiency trend analysis and seasonal performance comparisons.
Open Source Gateway — Planned
The Raspberry Pi server API and Modbus telemetry collection scripts are planned for open-source release — enabling the DIY solar community to self-host the gateway on any compatible hardware. The Android app will be available on the Play Store.

Tools & Technologies

A lean, purpose-built stack optimized for low-power edge hardware and real-time mobile data delivery.

// Gateway / Protocol Layer
Raspberry Pi
Python
Modbus RTU / RS-232
Local REST API
WebSocket Server
SQLite
// Mobile App Layer
Android
WebSocket Client
Data Visualization
Weather API
Yield Forecasting

Interested in solar telemetry or edge IoT?

Whether you're working on green energy monitoring, industrial IoT, or embedded systems — reach out to discuss the project or a potential collaboration.

Engineering Deep-Dive • Protocol & Architecture Case Study

RS-232 → Modbus → REST → WebSocket → Android

This section documents the full-stack engineering of Helioview — from low-level serial register polling to real-time mobile data delivery. Every layer was designed, built, and deployed by Teejay Tamani.

End-to-End Data Flow

From inverter register to mobile screen — every step in the pipeline is low-latency and runs without external cloud dependency.

+-----------------------------------------------------------+
|          Solar Inverter Hardware                          |
|   - Modbus RTU register map (AC/DC/Battery/Grid)         |
|   - RS-232 serial interface                               |
+-------------------------+---------------------------------+
                          |  RS-232 Serial (Modbus RTU)
                          v
+-----------------------------------------------------------+
|          Raspberry Pi Protocol Gateway                    |
|   Python Serial Polling Daemon:                           |
|   - Configurable poll interval (e.g. 1s / 5s)            |
|   - Modbus register decode & unit conversion             |
|   - SQLite persistence for historical logging             |
|   - REST API: GET /telemetry/live  /history/:range        |
|   - WebSocket server: push on each poll cycle             |
+-------------------------+---------------------------------+
                          |  REST API / WebSocket (LAN/WiFi)
                          v
+-----------------------------------------------------------+
|          Android App — Helioview                          |
|   - WebSocket client for real-time metric stream          |
|   - REST client for historical data & forecast queries    |
|   - Interactive chart rendering (live + historical)       |
|   - Weather API integration for forecast context          |
|   - Yield prediction engine (weather x history model)     |
+-----------------------------------------------------------+

RS-232 & Modbus RTU Implementation

The most technically demanding part of the stack — working at the hardware communication layer with no abstraction layer between the code and the inverter's register map.

Serial Communication over RS-232
The Raspberry Pi connects to the inverter via its RS-232 serial port. A Python serial daemon opens the port at the inverter's configured baud rate, sends Modbus function code 03 (Read Holding Registers) frames, and reads raw byte responses on a configurable poll interval.
  • Configurable baud rate, parity, stop bits per inverter spec
  • Modbus FC03 Read Holding Registers
  • CRC-16 checksum validation on every response frame
  • Automatic reconnect on serial port fault
Register Map Decoding & Unit Conversion
Raw 16-bit register values from the inverter are meaningless without the manufacturer's register map. The daemon decodes each register according to the inverter's documentation — applying scaling factors and unit conversions to produce human-readable metrics (V, A, W, kWh, %).
  • Configurable register map (JSON-based, per inverter model)
  • Scaling factor & offset application per register
  • Multi-register 32-bit value reconstruction
  • Metrics: PV voltage/current/power, battery SOC, grid export, load
Local REST API & WebSocket Server
The gateway exposes a lightweight REST API and WebSocket server on the local network. On every successful poll cycle, decoded metrics are pushed over the WebSocket to all connected clients. REST endpoints serve historical data queries and system status.
  • WebSocket broadcast on each poll cycle
  • REST: /telemetry/live, /telemetry/history, /system/status
  • SQLite write for every poll — full historical record
  • Configurable data retention policy

Mobile App & Yield Prediction Engine

The Android app is the user-facing product layer — combining real-time inverter data, historical trends, weather context, and predictive analytics in one interface.

Real-Time Dashboard
The home screen connects to the gateway WebSocket on launch and renders live metrics as they arrive — PV generation, battery state of charge, grid import/export, and load consumption — updated every poll cycle without manual refresh.
  • Live WebSocket connection with auto-reconnect
  • Animated live power flow indicators
  • Instantaneous efficiency & current load metrics
Historical Performance Charts
Users can query and visualize historical generation and consumption data across custom date ranges. Charts are interactive — zoomable and scrollable — allowing detailed analysis of daily generation curves, battery cycling behavior, and grid dependency patterns.
  • Zoomable, scrollable interactive charts
  • Daily / weekly / monthly / custom range views
  • Generation vs. consumption overlay
  • Battery charge cycle visualization
Weather & Yield Forecast
Weather forecast data is integrated with the system's historical generation baseline to predict expected solar yield for upcoming days. The model accounts for cloud cover, UV index, and seasonally adjusted generation curves — surfaced as a day-by-day expected output forecast.
  • Multi-day weather forecast API integration
  • Cloud cover & UV index correlation with historical output
  • Expected kWh yield per day forecast
  • Best-window recommendations for high-load activities